Ryan Tannehill
11318 replies
 The GuyForum Veteran
"FinFaninBuffalo wrote:
That is close enough to -1 for me.
And the win percentage, with a z-score of -0.33?
 FinFaninBuffaloForum Veteran
"The Guy wrote:
And the win percentage, with a z-score of -0.33?
too easily skewed by one decent season.
Film first, numbers second. If the numbers don’t match what is seen on film, something is likely wrong with the numbers.
The GuyForum Veteran"FinFaninBuffalo wrote:
too easily skewed by one decent season.
If you remove 2016 from the analysis, the team's z-score becomes -0.54.
NWE 2.22
SEA 1.58
DEN 1.21
CAR 1.02
PIT 1.02
CIN 0.75
NOR 0.75
IND 0.66
KAN 0.66
GNB 0.57
MIN 0.57
PHI 0.47
BAL 0.38
DAL 0.29
STL 0.29
ARI 0.20
SDG 0.20
ATL 0.01
HOU -0.08
CHI -0.17
SFO -0.17
BUF -0.35
DET -0.35
MIA -0.54
WAS -0.72
NYJ -1.00
NYG -1.09
TEN -1.09
JAX -1.73
TAM -1.73
OAK -1.82
CLE -2.01
Now you're simply proposing that a team was significantly below average in win percentage over six of seven consecutive years.
That's not easy to do in a league geared toward parity! Only 22% of the teams in the league fit that bill.
 resnorForum Veteran
"The Guy wrote:
Again, here we go with my exploring the objective support (or the lack thereof) for a claim you're making.
Define the thing yourself and then we can investigate it in the way you've defined it!
This is why I started this back-and-forth with you by insisting that you define your terms, but here we are once again with my doing the objective exploration of the issue, only to have you say the method of exploration doesn't hit the target.
Then you do it!
Post 6958 on page 173, I asked you to define average, after you declared that dolphins teams have been average. Finally on this page you posted some wacky definition of average, based on parameters YOU defined. You didn't take an average. You made a range and declared that average fell in that range. I asked you to explain, you told me I wasn't being objective.
What did I miss?
resnorForum VeteranFurther, I've never said the dolphins overall were or weren't average. I've argued that the oline was below average. I've argued our receivers were below average. I've argued the coaching was below average. These are things that I'm not making up, it's where we rank, man.
resnorForum VeteranAlso, you put a list together, with Miami in the bottom third, but declare that that somehow makes then average.
I'll never understand stats.
Or at least not how you apply them.
The GuyForum Veteran"resnor wrote:
Post 6958 on page 173, I asked you to define average, after you declared that dolphins teams have been average. Finally on this page you posted some wacky definition of average, based on parameters YOU defined. You didn't take an average. You made a range and declared that average fell in that range. I asked you to explain, you told me I wasn't being objective.
What did I miss?
Put this back into the bigger picture context -- what we're talking about is whether Tannehill went from 1) bad surroundings to average surroundings, 2) average surroundings to good surroundings, or 3) bad surroundings to good surroundings.
The prevailing belief is that it was possibility #3 (or possibly #1, but certainly not #2), and so what we're determining now is whether the team was significantly different from average during Tannehill's tenure with it.
If the team wasn't significantly worse than average during Tannehill's tenure with it, then the change in his performance in 2019 can't possibly be explained by his having gone from a bad team to something better.
Instead we have to start with the notion that he came from merely an average team, and then it becomes more likely that the surroundings he was experiencing in 2019 were exceptionally good.
The GuyForum Veteran"resnor wrote:
Also, you put a list together, with Miami in the bottom third, but declare that that somehow makes then average.
I'll never understand stats.
Or at least not how you apply them.
Take a look at this image:
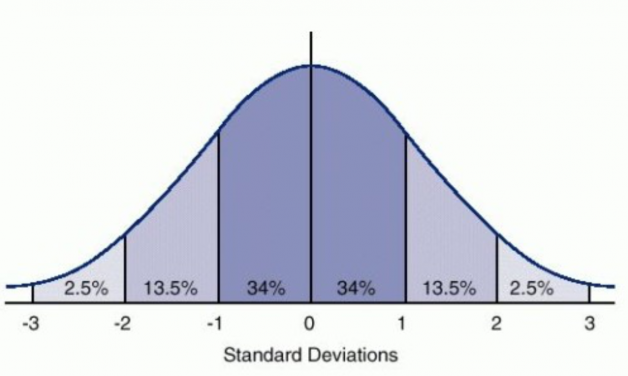
"Standard deviations" above is interchangeable with z-scores. This is how just about anything in the world is distributed, including team win percentages in the NFL. You notice above that 68% of the values (in this case win percentages) fall within one standard deviation of average. Those are your average teams -- they are "nothing special" (or nothing exceptional) either way. The ones that fall beyond that, on either side, are your teams that are above or below average.
 LosferwordsForum Veteran
"The Guy wrote:
Take a look at this image:
"Standard deviations" above is interchangeable with z-scores. This is how just about anything in the world is distributed, including team win percentages in the NFL. You notice above that 68% of the values (in this case win percentages) fall within one standard deviation of average. Those are your average teams -- they are "nothing special" (or nothing exceptional) either way. The ones that fall beyond that, on either side, are your teams that are above or below average.
Save your breath... you're arguing with fanboys.
Guy
Last year the Miami Dolphins had the worst point total differential in the league.... They were dead last. It is arguable that they were the worst team in football last year.
Yeah they sucked.
The GuyForum Veteran"Etrius24 wrote:
Guy
Last year the Miami Dolphins had the worst point total differential in the league.... They were dead last. It is arguable that they were the worst team in football last year.
Yeah they sucked.
You consistently have trouble placing your comments within the most basic context of the discussion.
"The Guy wrote:
And because of that I'm fully comfortable concluding that we don't know the caliber of Tannehill's surroundings 2012-2018. I'm certainly not going to let a consensus of the team's most ardent supporters determine that.
In other words, we shouldn't analyze the cause of his change in performance in 2019 as though we know for certain his surroundings 2012-2018 were bad, simply because a bunch of the team's most ardent supporters believe that.
The change in the quality of Tannehill's surroundings from 2012-2018 to 2019, if any, is unknown.
FinFaninBuffaloForum Veteran"The Guy wrote:
If you remove 2016 from the analysis, the team's z-score becomes -0.54.
NWE 2.22
SEA 1.58
DEN 1.21
CAR 1.02
PIT 1.02
CIN 0.75
NOR 0.75
IND 0.66
KAN 0.66
GNB 0.57
MIN 0.57
PHI 0.47
BAL 0.38
DAL 0.29
STL 0.29
ARI 0.20
SDG 0.20
ATL 0.01
HOU -0.08
CHI -0.17
SFO -0.17
BUF -0.35
DET -0.35
MIA -0.54
WAS -0.72
NYJ -1.00
NYG -1.09
TEN -1.09
JAX -1.73
TAM -1.73
OAK -1.82
CLE -2.01Now you're simply proposing that a team was significantly below average in win percentage over six of seven consecutive years.
That's not easy to do in a league geared toward parity! Only 22% of the teams in the league fit that bill.
Your own list shows SEVEN teams with z scores of -1 or lower. SEVEN. How could those be???? I mean, that must be near impossible right? Parity, parity parity. Your list show 22% of the teams with a score of -1 or less, not the 16% you predicted. How could those be???? I mean, that must be near impossible right? Parity, parity parity. Guess what? It is not a normal distribution. It is skewed to the left. Most of the teams at the bottom would be recognized as poor franchises by NFL fans.
I still maintain that margin of victory is a better stat because it takes into account score differential. A team that loses 10 games by 10 points each is not the same as a team that loses by 1 point each. You are purposely throwing away information because it doesn't fit your agenda.
A z score of -0.84. Poor team, case closed.
Film first, numbers second. If the numbers don’t match what is seen on film, something is likely wrong with the numbers.
 Fin-OForum Veteran
When Tannehill has an above average supporting cast he has proven to be a well above average QB, when he has less than that he has proven to be average himself.
This should be an easy conclusion to come too, no?
"The reason so many people misunderstand so many issues is not that these issues are so complex, but that the people do not want a factual or analytical explanation that leaves them emotionally unsatisfied"
The GuyForum Veteran"FinFaninBuffalo wrote:
Your own list shows SEVEN teams with z scores of -1 or lower. SEVEN. How could those be???? I mean, that must be near impossible right? Parity, parity parity. Your list show 22% of the teams with a score of -1 or less, not the 16% you predicted. How could those be???? I mean, that must be near impossible right? Parity, parity parity. Guess what? It is not a normal distribution. It is skewed to the left. Most of the teams at the bottom would be recognized as poor franchises by NFL fans.
I still maintain that margin of victory is a better stat because it takes into account score differential. A team that loses 10 games by 10 points each is not the same as a team that loses by 1 point each. You are purposely throwing away information because it doesn't fit your agenda.
A z score of -0.84. Poor team, case closed.
LOL -- spoken by someone whose threshold for below average changed from -1 to -0.84 because that's where the team fell during the period of time in question.
The GuyForum Veteran"Fin-O wrote:
When Tannehill has an above average supporting cast he has proven to be a well above average QB, when he has less than that he has proven to be average himself.
This should be an easy conclusion to come too, no?
No, that isn't the contention, apparently. The contention is that the Dolphins' surroundings were a tremendous ball-and-chain on him, and so the Dolphins' must've been especially poor 2012-2018. All he needed was the roughly average surroundings he had in Tennessee in 2019 and he'd blossom.
It can't be that the Dolphins' surroundings were average and the ones in Tennessee were exceptionally good -- that's impossible because lots of people on a message board said so, and people on a message board are never wrong, especially when lots of them agree about something.
Message board consensus = reality.
resnorForum Veteran"The Guy wrote:
Put this back into the bigger picture context -- what we're talking about is whether Tannehill went from 1) bad surroundings to average surroundings, 2) average surroundings to good surroundings, or 3) bad surroundings to good surroundings.
The prevailing belief is that it was possibility #3 (or possibly #1, but certainly not #2), and so what we're determining now is whether the team was significantly different from average during Tannehill's tenure with it.
If the team wasn't significantly worse than average during Tannehill's tenure with it, then the change in his performance in 2019 can't possibly be explained by his having gone from a bad team to something better.
Instead we have to start with the notion that he came from merely an average team, and then it becomes more likely that the surroundings he was experiencing in 2019 were exceptionally good.
But how can you test whether or not Tannehill actually made those garbage players better? I mean, he turned Hartline into a 1000 yard receiver, for instance. He took over a 2-4 Tennessee team, and lead then to the playoffs, and they looked very different with him at QB then they did with Mariota.
You are ignoring the possibility that while Tannehill had garbage in Miami, he actually made them look better than they were.
resnorForum VeteranWho is claiming that the Tennessee was "exceptionally good" surroundings? You are putting words into many people mouths.
Fin-OForum Veteran"The Guy wrote:
No, that isn't the contention, apparently. The contention is that the Dolphins' surroundings were a tremendous ball-and-chain on him, and so the Dolphins' must've been especially poor 2012-2018. All he needed was the roughly average surroundings he had in Tennessee in 2019 and he'd blossom.
It can't be that the Dolphins' surroundings were average and the ones in Tennessee were exceptionally good -- that's impossible because lots of people on a message board said so, and people on a message board are never wrong, especially when lots of them agree about something.
Message board consensus = reality.
To me the biggest ball and chain in Ryan’s Dolphins tenure was Adam Gase.
I wouldn’t dispute that his ineptitude made the surroundings that much more crappy.
I will say his surroundings in TN with that offense and that staff are pretty ideal for any QB. I mean, look at Ryan’s numbers in two playoff wins? You don’t win those games with your Qb playing like that with just an average supporting offensive cast.
I hope they win the SB next year however. They need another WR and DE and they are as dangerous as any AFC team not names KC.
"The reason so many people misunderstand so many issues is not that these issues are so complex, but that the people do not want a factual or analytical explanation that leaves them emotionally unsatisfied"
The GuyForum Veteran"resnor wrote:
But how can you test whether or not Tannehill actually made those garbage players better? I mean, he turned Hartline into a 1000 yard receiver, for instance. He took over a 2-4 Tennessee team, and lead then to the playoffs, and they looked very different with him at QB then they did with Mariota.
You are ignoring the possibility that while Tannehill had garbage in Miami, he actually made them look better than they were.
We can't test that, and like I said above, I'm comfortable saying we don't know the degree to which Tannehill's surroundings changed from 2012-2018 to 2019.
What I'm not comfortable saying is that we know his surroundings 2012-2018 were exceptionally bad only because a bunch of people on a message board agreed about it.
The GuyForum Veteran"Fin-O wrote:
I will say his surroundings in TN with that offense and that staff are pretty ideal for any QB. I mean, look at Ryan’s numbers in two playoff wins? You don’t win those games with your Qb playing like that with just an average supporting offensive cast.
The noteworthy thing there is that his percentage of pass dropbacks in the first two playoff games was 6.3 standard deviations below the regular season league average in 2019. In the regular season he had the second-lowest percentage of pass dropbacks in the league (only Lamar Jackson was lower, for obvious reasons).
So yeah, if your team has the luxury (provided by Derrick Henry) of essentially having you drop back to pass the ball only when the circumstances are highly favorable, then of course you're going to perform well!
Now, let's see if that situation is sustainable or replicable in future seasons. I suspect not.
FinFaninBuffaloForum Veteran"The Guy wrote:
LOL -- spoken by someone whose threshold for below average changed from -1 to -0.84 because that's where the team fell during the period of time in question.
Why would you use less descriptive data?
Film first, numbers second. If the numbers don’t match what is seen on film, something is likely wrong with the numbers.
FinFaninBuffaloForum Veteran"The Guy wrote:
the ones in Tennessee were exceptionally good -- that's impossible because lots of people on a message board said so
Their 2-4 record and 16 points per game said so. You are proof that people on message boards are often wrong.
Film first, numbers second. If the numbers don’t match what is seen on film, something is likely wrong with the numbers.
FinFaninBuffaloForum Veteran"The Guy wrote:
So yeah, if your team has the luxury (provided by Derrick Henry) of essentially having you drop back to pass the ball only when the circumstances are highly favorable, then of course you're going to perform well!
Prove that they were highly favorable, objectively. I have proof they weren't.
Film first, numbers second. If the numbers don’t match what is seen on film, something is likely wrong with the numbers.
resnorForum Veteran"The Guy wrote:
We can't test that, and like I said above, I'm comfortable saying we don't know the degree to which Tannehill's surroundings changed from 2012-2018 to 2019.
What I'm not comfortable saying is that we know his surroundings 2012-2018 were exceptionally bad only because a bunch of people on a message board agreed about it.
But Guy, literally NO ONE says Miami was bad simply because we think they were bad. That's a strawman argument you've created. We've given tons of stats and facts about the oline, about the coaching, etc, to demonstrate why they were bad.
My issue is, you're saying there's things that can't be proven, but then you discount that by saying that they were average.